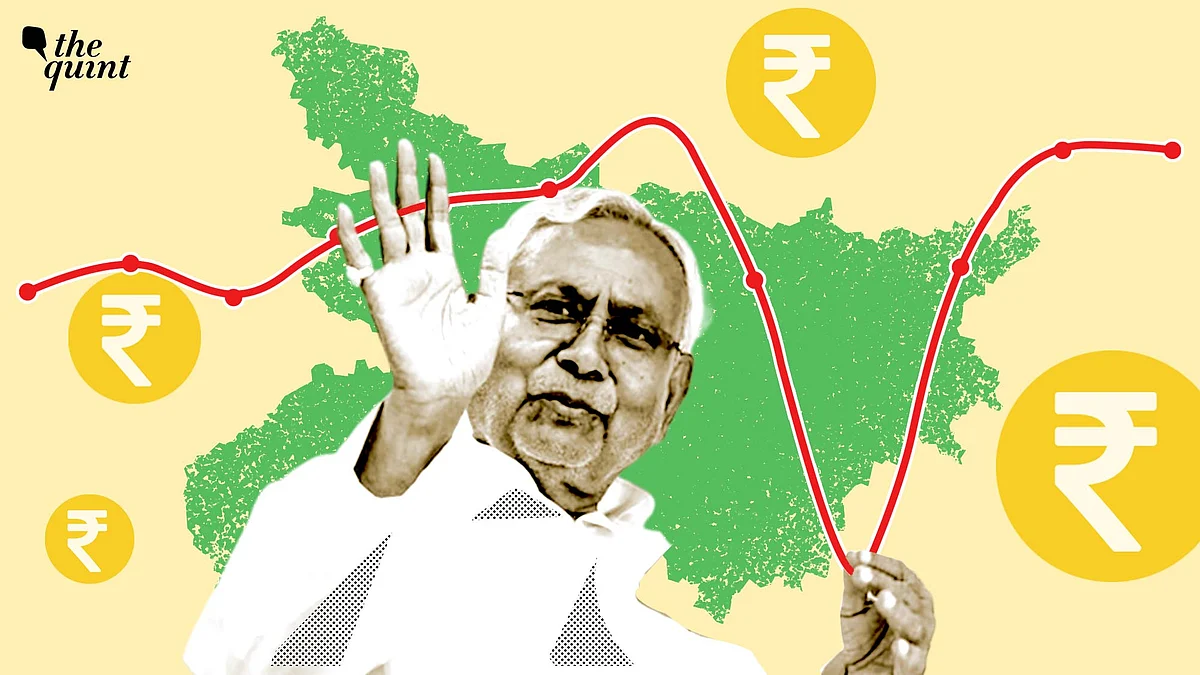
When Janata Dal (United) leader Nitish Kumar assumed the position of Bihar Chief Minister, nobody could have predicted the unprecedented stronghold that Kumar would have in the state.Kumar is currently serving as the CM for the ninth time, where his party has forged and broken alliances with the Rashtriya Janata Dal (RJD) and the Bharatiya Janata Party (BJP) multiple times.When the JDU leader became the chief minister for the second time in 2005, the state of Bihar was plagued with several issues. The period often termed as ‘Jungle Raj’ saw former CM Rabri Devi at the helm of power. Since then, Kumar has credited himself and his party for pulling the state out of ‘Jungle Raj’.In this series, The Quint’s WebQoof will publish different stories that will highlight how the JDU (with different alliances) has performed in the state. This first part will majorly focus on what impact did the government have on the economy.From TV Channels to Social Media: How Fake News About Op Sindoor Was SharedThe RJD remained in power in Bihar in the early 2000s with a brief stint of nine days under Kumar. This makes it clear that former CM Devi and her government were largely responsible for the state’s economy.According to the data available on the website of Ministry of Statistics and Program Implementation (MoSPI), the Gross State Domestic Product (GSDP) at constant price in the financial year 2000-2001 was Rs 58,223 crore.The next three years witnessed an irregular growth rate, with the financial years 2001-02 as well as 2003-04 registering negative percent. However, FY 2002-03 saw a positive year-on-year growth rate of 11.82 percent.The 2005 Bihar assembly elections saw a shift, when Kumar’s JDU emerged as the single largest party and then later forged an alliance with the BJP to form a government.While the financial year 2005-06 saw around negative 1.69 percent growth rate, 2006-07 witnessed a huge rate of 16.18 percent. It can be seen that the trend of the economy scaling up and declining remained, however, the growth rate remained in positive. The latter was different than what was seen during the early 2000s.We noticed that Bihar’s economy witnessed a steady growth rate (except FY 2014-15) for around six years, until witnessing a major drop as well as a negative growth rate in the FYs 2019-20 and 2020-21 respectively.It should be noted that the FY 2020-21 was heavily impacted by the COVID-19 pandemic, where other states too witnessed a similar negative growth.While Hindustani Awam Morcha (HAM) leader Jitan Ram Manjhi served as the state’s CM for a brief period from May 2014 to February 2015, the last decade was heavily dominated by Kumar and his party.The state witnessed an average growth rate of 5.51 percent from FY 13 to FY 2024. (Data sourced: Year and State-wise Amount of Gross State Domestic Product (GSDP) at Current and Constant Prices for the Base Years 1980-81, 1993-94, 1999-00, 2004-05 and 2011-12 [Dataset]. Dataful.) What Data Says About BJP’s Performance in Gujarat in the Last Decade?(Not convinced of a post or information you came across online and want it verified? Send us the details on WhatsApp at 9540511818 , or e-mail it to us at webqoof@thequint.com and we’ll fact-check it for you. You can also read all our fact-checked stories here.)(At The Quint, we question everything. Play an active role in shaping our journalism by becoming a member today.)
